Monday, July 29, 2013

The end of an era and the start of a new chapter

Well, there had to come a point when I pulled my finger out, pulled up my socks and opened my laptop to finally write a blogpost.

I know I've been utter pants over the last few months.

It's not as though I've had no news to share. I've probably had too much and I never even blogged about the impromptu moment I asked the legendary Michael Parkinson about his rubbish.

But now that the school holidays are upon us, this is the first occasion I've had to properly slow down since September last year and stay at home instead of gallivanting around the country.

And this holiday feels like a period of transition in more ways than one.

On a personal level, our youngest has just left primary school and is getting ready to start middle school in September.  Yes, that little man who was only 3 when I started this blog has just turned 9 and is growing up.  To watch him confidently leave one school and be ready to embark on the next stage of his life feels like a real milestone.

Elsewhere, I've spent the last 8 months coming to terms with my mother's unexpected death in December.  Nothing can prepare you for losing a parent and I'm very aware that the constant flow of activities and deadlines this year have kept me very distracted, so much so that when we completed the sale of her house last week, it kicked me so hard that it felt like she'd died all over again.  My mother taught me lots about what's important in life and much of that teaching was in her death.  One day, I hope to share her wisdom - not yet but soon - the wisdom of an average woman who would never have expected to have been considered remarkable but in many ways truly was.  I really wish she was still here to see what's around the corner.  I know she'd be one of the first to laugh at my misadventures and then, without me knowing, quietly share her pride.

For things are changing on The Rubbish Diet front and at a rate of knots too.  Remember that Nesta competition I entered last year in partnership with Cwm Harry and Rachelle Strauss from My Zero Waste?  We're still right in the middle of the challenge and following the success of running the Rubbish Diet in Suffolk and Shropshire (which even saw 22 households in one street taking part in Shrewsbury), the novel bin slimming action is spreading to Ludlow and very soon Powys, the latter of which will be launched during this year's National Zero Waste Week, 2-8 September.   If you haven't checked out Zero Waste Week yet, go and have a peek at its new website and do get involved, especially if you need to get tough with your food waste.

But there's lots happening between now and then.  Don't miss 'yours truly' helping a family slim their bin as part of the Throwaway Britain Tonight documentary, which is being broadcast this Thursday 1st August (9pm, ITV1).  Without giving away the final reveal, I can't wait for you to see how Sandra and her family tackled their waste. 

And to give you even further inspiration to reduce waste, I've been pulling together the first UK tour of the Clean Bin Project documentary, which will see my old Canadian blogging friend Jen and her partner Grant travelling around the UK, to attend screenings of their movie in Brighton, Suffolk, York, Shrewsbury (tbc) and Wiltshire.  The official dates and venues for late August will be published soon, but if you'd like to know more please email me.

But coming back to the most major thing that's happening in my life right now, although I'm taking time out to enjoy the events of the summer holidays and pause for reflection, it's also a time for significant change, especially as the success of The Rubbish Diet trials featured in the Nesta competition has led to much interest from a range of local authorities.

The Rubbish Diet has already travelled a long way from being just a random housewife with a blog.  In the last year, it has developed into a website and a team to support the Nesta Waste Reduction competition.  And now, still in conjunction with the 'Do Think' Tank Cwm Harry (the people who are also behind the People's Design Lab), we are preparing for the next stage, which will see The Rubbish Diet becoming a social enterprise, developed to help households and communities reduce their waste by 50% within as little time as eight weeks.  More info on the next stage will be available soon, as will the final results of the Nesta competition later in the year.  Meanwhile if The Rubbish Diet challenge launches in your neck of the woods, do join in and say hello.

With so much happening it really does feel like the end of an era and the beginning of an exciting and potentially nerve-wracking new chapter.

Thank you for sticking with the rubbish adventures of this Almost Mrs Average over the last five years.  I know there are lots more adventures to be had yet, but from now on it will be in a very different context.

I just hope I will still have time to blog about them.

Could grain-fed beef liver be particularly nutritious?


There is a pervasive belief today that grain-fed beef is unhealthy, a belief that I addressed before in this blog () and that I think is exaggerated. This general belief seems to also apply to a related meat, one that is widely acknowledged as a major micronutrient “powerhouse”, namely grain-fed beef liver.

Regarding grain-fed beef liver, the idea is that cattle that are grain-fed tend to develop a mild form of fatty liver disease. This I am inclined to agree with.

However, I am not convinced that this is such a bad thing for those who eat grain-fed beef liver.

In most animals, including Homo sapiens, fatty liver disease seems to be associated with extra load being put on the liver. Possible reasons for this are accelerated growth, abnormally high levels of body fat, and ingestion of toxins beyond a certain hormetic threshold (e.g., alcohol).

In these cases, what would one expect to see as a body response? The extra load is associated with high oxidative stress and rate of metabolic work. In response, the body should shuttle more antioxidants and metabolism catalysts to the organ being overloaded. Fat-soluble vitamins can act as antioxidants and catalysts in various metabolic processes, among other important functions. They require fat to be stored, and can then be released over time, which is a major advantage over water-soluble vitamins; fat-soluble vitamins are longer-acting.

So you would expect an overloaded liver to have more fat in it, and also a greater concentration of fat-soluble vitamins. This would include vitamin A, which would give the liver an unnatural color, toward the orange-yellow range of the spectrum.

Grain-fed beef liver, like the muscle meat of grain-fed cattle, tends to have more fat than that of grass-fed animals. One function of this extra fat could be to store fat-soluble vitamins. This extra fat appears to have a higher omega-6 fat content as well. Still, beef liver is a fairly lean meat; with about 5 g of fat per 100 g of weight, and only 20 mg or so of omega-6 fat. Clearly consumption of beef liver in moderation is unlikely to lead to a significant increase in omega-6 fat content in one’s diet (). By consumption in moderation I mean approximately once a week.

The photo below, from Wikipedia, is of a dish prepared with foie gras. That is essentially the liver of a duck or goose that has been fattened through force-feeding, until the animal develops fatty liver disease. This “diseased” liver is particularly rich in fat-soluble vitamins; e.g., it is the best known source of the all-important vitamin K2.


Could the same happen, although to a lesser extent, with grain-fed beef liver? I don’t think it is unreasonable to speculate that it could.

Monday, July 15, 2013

How can carrying some extra body fat be healthy?


Most of the empirical investigations into the association between body mass index (BMI) and mortality suggest that the lowest-mortality BMI is approximately on the border between the normal and overweight ranges. Or, as Peter put it (): "Getting fat is good."

As much as one may be tempted to explain this based only on the relative contribution of lean body mass to total weight, the evidence suggests that both body fat and lean body mass contribute to this phenomenon. In fact, the evidence suggests that carrying some extra body fat may be healthy for many.

Yet, the scientific evidence strongly suggests that body fat accumulation beyond a certain point is unhealthy. There seems to be a sweet spot of body fat percentage, and that sweet spot may vary a lot across different individuals.

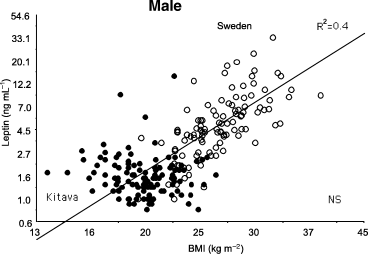
One interesting aspect of most empirical investigations of the association between BMI and mortality is that the participants live in urban or semi-urban societies. When you look at hunter-gatherer societies, the picture seems to be a bit different. The graph below shows the distribution of BMIs among males in Kitava and Sweden, from a study by Lindeberg and colleagues ().


In Sweden, a lowest mortality BMI of 26 would correspond to a point on the x axis that would rise up approximately to the middle of the distribution of data points from Sweden in the graph. It is reasonable to assume that this would also happen in Kitava, in which case the lowest mortality BMI would be around 20.

One of the key differences between urbanites and hunter-gatherers is the greater energy expenditure among the latter; hunter-gatherers generally move more. This provides a clue as to why some extra body fat may be healthy among urbanites. Hunter-gatherers spend more energy, so they have to consume more “natural” food, and thus more nutrients, to maintain their lean body mass.

A person’s energy expenditure is strongly dependent on a few variables, including body weight and physical activity. Let us assume that a hunter-gatherer, due to a reasonably high level of physical activity, maintains a BMI of 20 while consuming 3,000 kilocalories (a.k.a. calories) per day. An urbanite with the same height, but a lower level of physical activity, may need a higher body weight, and thus a higher BMI, to consume 3,000 calories per day at maintenance.

And why would someone want to consume 3,000 calories per day? Why not 1,500? The reason is nutrient intake, particularly micronutrient intake – intake of vitamins and minerals that are used by the body in various processes. Unfortunately it seems that micronutrient supplementation (e.g., a multivitamin pill) is largely ineffective except in cases of pathological deficiency.

Urbanites may need to carry a bit of extra body fat to be able to have an appropriate intake of micronutrients to maintain their lean body structures in a healthy state. Obviously the type of food eaten matters a lot. A high nutrient-to-calorie ratio is generally desirable. However, we cannot forget that we also need to eat fat, in part because without it we cannot properly absorb the all-important fat-soluble vitamins. And dietary fat is the most calorie-dense nutrient of all.

Why not putting on extra muscle instead of carrying the extra fat? For one, that is not easy when you are a sedentary urbanite. Particularly after a certain age, if you try too hard you end up getting injured. But there is another interesting angle to consider. Humans, like many other animals, have genetic “protections” against high muscularity, such as the protein myostatin. Myostatin is produced mostly in muscle cells; it acts on muscle, by inhibiting its growth.

Say what? Why would evolution favor something like myostatin? Big, muscular humans could be at the top of the food chain by physical strength alone; they could kill a lion with their bare hands. Well, it is possible. (Many men like to think of themselves as warriors, probably because most of them are not.) But evolution favors what works best given the ecological niches available. In our case, it favored bigger and more plastic brains to occupy what Steve Pinker called a “cognitive niche”.

Even though fat mass is not inert, secreting a number of hormones into the bloodstream, the micronutrient “need” of fat mass is likely much lower than the micronutrient need of non-fat mass. That is, a kilogram of lean mass likely puts a higher demand on micronutrients than a kilogram of fat mass. This should be particularly the case for organs, such as the liver, but also applies to muscle tissue.

While gaining muscle mass through moderate exercise is extremely healthy, bulking up beyond one’s natural limitations may actually backfire. It could increase the demand for micronutrients above what a person can actually consume and absorb through a healthy nutritious diet. Some extra fat mass allows for a higher level of micronutrient intake at weight maintenance, with a lower demand for micronutrients than the same amount of extra lean mass.

Some people are naturally more muscular. Their frame and underlying organ-based capabilities probably support that. It is often visibly noticeable when they go beyond their organ-based capabilities. A common trait among many professional bodybuilders, who usually go beyond the genetic gifts that they naturally have, is an abnormal swelling of internal organs.

What complicates this discussion is that all of this seems to vary from individual to individual. People have to find their sweet spots, and doing that may not be the simplest of tasks. For example, even measuring body fat percentage with some precision is difficult and costly. Also, certain types of fat are less desirable than others – visceral versus subcutaneous body fat. It is not easy differentiating one from the other ().

How do you find your sweet spot in terms of body fat percentage? One of the most promising approaches is to find the point at which your waist-to-weight ratio is minimized ().

Monday, July 1, 2013

An illustration of the waist-to-weight ratio theory: The fit2fat2fit experiment


In my previous blog post, I argued that one’s optimal weight may be the one that minimizes one’s waist-to-weight ratio. I built this argument based on the fact that body fat percentage is associated with lean body mass (and also weight) in a nonlinear way.

The fit2fat2fit experiment (), provides what seems to be an interestingly way to put this optimal waist-to-weight ratio theory to test. This is due to a fortuitous event, as I explain in this post.

In this experiment, Drew Manning, a personal trainer, decided to undergo a transformation where he went from what he argued was his fittest level, all the way to obese, and then back to fit again. He said that he wanted to do that so that he could better understand his clients’ struggles. This may be true, but it looks like he planned very well his experiment from a marketing perspective.

His fittest level was at the start, with a weight of 193 lbs, at a height of 6 ft 2 in. That was his fittest level according to his own opinion. At that point, he had a waist of 34.5 in, and looked indeed very fit (). At his fattest level, he reached the weight of 264.8 pounds, with a 47.5 waist.

As he moved back to fit, one interesting thing happened. Toward the end of this journey back to fit, he moved past the level that he felt was his optimal. He dropped down to 190.1 lbs, and a 34 in waist; which he perceived as too skinny. He talks about this in a video ().

As a self-defined “fanatic” personal trainer, I figured that he knew when he had gone too far. That is, he is probably as qualified as one can get to identify the point at which he moved past his optimal. So I thought that this would be an interesting way of putting my optimal waist-to-weight ratio theory to the test.

Below is a bar chart showing variations in waist-to-weight ratio against weight for Drew Manning during his fit2fat2fit experiment. I included only three data points in this chart because I would have to view all of his video clips to get all of the data points.


As you can see, at the point at which he felt he was too thin, his waist-to-weight ratio clearly started going up from what seems to have been its optimal at 34.5 in / 193 lbs. This is exactly what you would expect based on my optimal waist-to-weight ratio theory. You probably can’t tell that something was not right at that point, because he looked very fit.

But apparently he felt that something was not entirely right. And that is consistent with the idea that he had passed his optimal waist-to-weight ratio, and became too lean for his own good. Note that his waist decreased, and probably could go down even further, even though that was no longer optimal.

Monday, June 17, 2013

What is your optimal weight? Maybe it is the one that minimizes your waist-to-weight ratio


There is a significant amount of empirical evidence suggesting that, for a given individual and under normal circumstances, the optimal weight is the one that maximizes the ratio below, where: L = lean body mass, and T = total mass.

L / T

L is difficult and often costly to measure. T can be measured easily, as one’s total weight.

Through some simple algebraic manipulations, you can see below that the ratio above can be rewritten in terms of one’s body fat mass (F).

L / T = (T – F) / T = 1 – F / T

Therefore, in order to maximize L / T, one should maximize 1 – F / T. This essentially means that one should minimize the second term, or the ratio below, which is one’s body fat mass (F) divided by one’s weight (T).

F / T

So, you may say, all I have to do is to minimize my body fat percentage. The problem with this is that body fat percentage is very difficult to measure with precision, and, perhaps more importantly, body fat percentage is associated with lean body mass (and also weight) in a nonlinear way.

In English, it becomes increasingly difficult to retain lean body mass as one's body fat percentage goes down. Mathematically, body fat percentage (F / T) is a nonlinear function of T, where this function has the shape of a J curve.

This is what complicates matters, making the issue somewhat counterintuitive. Six-pack abs may look good, but many people would have to sacrifice too much lean body mass for their own good to get there. Genetics definitely plays a role here, as well as other factors such as age.

Keep in mind that this (i.e., F / T) is a ratio, not an absolute measure. Given this, and to facilitate measurement, we can replace F with a variable that is highly correlated with it, and that captures one or more important dimensions particularly well. This new variable would be a proxy for F. One the most widely used proxies in this type of context is waist circumference. We’ll refer to it as W.

W may well be a very good proxy, because it is a measure that is particularly sensitive to visceral body fat mass, an important dimension of body fat mass. W likely captures variations in visceral body fat mass at the levels where this type of body fat accumulation seems to cause health problems.

Therefore, the ratio that most of us would probably want to minimize is the following, where W is one’s waist circumference, and T is one’s weight.

W / T = waist / weight


Based on the experience of HCE () users, variations in this ratio are likely to be small and require 4-decimals or more to be captured. If you want to avoid having so many decimals, you can multiply the ratio by 1000. This will have no effect on the use of the ratio to find your optimal weight; it is analogous to multiplying a ratio by 100 to express it as a percentage.

Also based on the experience of HCE users, there are fluctuations that make the ratio look like it is changing direction when it is not actually doing that. Many of these fluctuations may be due to measurement error.

If you are obese, as you lose weight through dieting, the waist / weight ratio should go down, because you will be losing more body fat mass than lean body mass, in proportion to your total body mass.

It would arguably be wise to stop losing weight when the waist / weight ratio starts going up, because at that point you will be losing more lean body mass than body fat mass, in proportion to your total body mass.

One’s lowest waist / weight ratio at a given point in time should vary depending on a number of factors, including: diet, exercise, general lifestyle, and age. This lowest ratio will also be dependent on one’s height and genetic makeup.

Mathematically, this lowest ratio is the ratio at which d(W / T) / dT = 0 and d(d(W / T) / dT) / dT > 0. That is, the first derivative of W / T with respect to T equals zero, and the second derivative is greater than zero.

The lowest waist / weight ratio is unique to each individual, and can go up and down over time (e.g., resistance exercise will push it down). Here I am talking about one's lowest waist / weight ratio at a given point in time, not one's waist / weight ratio at a given point in time.

This optimal waist / weight ratio theory is one of the most compatible with evidence regarding the lowest mortality body mass index (, ). Nevertheless, it is another ratio that gets a lot of attention in the health-related literature. I am talking about the waist / hip ratio (). In this literature, waist circumference is often used alone, not as part of a ratio.

Monday, June 3, 2013

Dr. Jekyll dieted and became Mr. Hyde


One of the most fascinating topics for an independent health researcher is the dichotomy between short- and long-term responses in successful dieters. In the short term, dieters that manage to lose a significant amount of fat mass, tend to feel quite well. Many report that their energy levels go through the roof.

A significant loss of fat mass could be considered one of 30 lbs, or 13.6 kg. This is the threshold for weight loss used in the National Weight Control Registry. Ideally you want to lose body fat, not lean mass, both of which contribute to weight loss.

So, in the short term, significant body fat loss feels pretty good for the dieters. In the long term, however, successful dieters tend to experience the symptoms of chronic stress. This should be no surprise because some of the same hormones that induce a sense of elation and high energy are the ones associated with chronic stress. These are generally referred to as “stress hormones”, of which the most prominent seem to be cortisol, epinephrine (adrenaline), and norepinephrine (noradrenaline).

Stress hormones display acute elevations during intense exercise as well ().

This is all consistent with evolution, and with the idea that our hominid ancestors would not go hungry for too long, at least not on a regular basis. High energy levels, combined with hunger, would make them succeed at hunting-gathering activities, leading to a period of feast before a certain threshold of sustained caloric restriction (with or without full fasting) would be reached. This would translate into a regular and cyclical hunger-feast process, with certain caloric costs having to be met for successful hunting-gathering.

After a certain period of time under sustained caloric restriction, it would probably be adaptive among our ancestors to experience significant mental and physical discomfort. That would compel our hominid ancestors to more urgently engaged in hunting-gathering activities.

And here is a big difference between those ancestors and modern urbanites: our ancestors would actually be working towards getting food for a feast, not restraining themselves from eating what they have easily available at home or from a grocery store nearby. There are major psychological differences here. Dieting, in the sense of not eating when food is easily available, is as unnatural as obesity, if not more.

So what are some of the mechanisms by which the body dials up stress, leading to the resulting mental and physical discomfort? Here is one that seems to play a key role: hypoglycemia.

Of the different types of hypoglycemia, there is one that is quite interesting in this type of context, because it refers to hypoglycemia in response to intake of any food item that raises insulin levels; that is, food that contains protein and/or carbohydrates. More specifically, we are referring here to reactive hypoglycemia, of the same general type as that experienced by those on their way to type II diabetes.

But reactive hypoglycemia in successful dieters is often different from that of prediabetics, as it is caused by something that would sound surprising to many: successful dieters appear to become too insulin sensitive for their own good!

There is ongoing debate as to what is considered a blood glucose level that is low enough to characterize hypoglycemia. Several factors influence that, including measurement method and age. One important factor related to measurement method is this: commercial fingerstick glucose meters tend to grossly underestimate low glucose levels (e.g., 50 mg/dl shows as 30 mg/dl).

Having said that, glucose levels below 60 mg/dl are generally considered low.

Luyckx and Lefebvre selected 47 cases of reactive hypoglycemia for a study, from a total of 663 standard four-hour oral glucose tolerance tests (OGTT). They classified these 47 cases as follows, with the number of cases in each class within parentheses: obesity (11), obesity with chemical diabetes (9), postgastrectomy syndrome (3), chemical diabetes without obesity (1), renal glycosuria (7), and isolated reactive hypoglycemia (16).

Postgastrectomy is the period following a gastrectomy, which is removal of part of one’s stomach. The modern term for this stomach amputation procedure is “bariatric surgery”; admittedly a broader term, which many people say they would do as if they were referring to a walk in the park!

In the cases of isolated reactive hypoglycemia, the individuals had normal weight, normal glucose tolerance, and no glycosuria (excretion of glucose in the urine). As you can see in the paragraph above, this, isolated reactive hypoglycemia, was the category with the largest number of individuals. The figure below illustrates what happened in these cases.


The cases in question are represented in the left part of the graph with dashed lines (the full lines are for normal controls). There a reasonably normal insulin response, lower in fact in terms of area under the curve (AUC) than for the controls, leads to an abnormal reduction in blood glucose levels. They are 9 out of 16, the majority of the isolated reactive hypoglycemia cases. In those 9 individuals, insulin became “more potent”, so to speak.

Reactive hypoglycemia is frequently associated with obesity, in which case it is also associated with hyperinsulinemia, and caused by an exaggerated insulin response. About 40 percent of the reactive hypoglycemia cases in the study were classified as happening in obese individuals.

This study suggests that, if you are not obese, and you are diagnosed with reactive hypoglycemia following an OGTT, chances are that the diagnosis is due to high insulin sensitivity – as opposed to low insulin sensitivity, coupled with hyperinsulinemia. A follow-up test should focus on insulin levels, to see if they are elevated; i.e., to try to detect hyperinsulinemia.

I have been blogging here long enough to hear from people who have gone the full fat2fit2fat cycle, sometimes more than once. They start dieting, go from obese to lean, feel good at first but then miserable, drop the diet, become obese or almost obese again, then start dieting again …

Quite a few are folks who do things like ditching industrial foods, regularly eating organ meats, and doing resistance exercise. How can you go wrong doing all of these, generally healthy, things? Well, they all increase your insulin sensitivity. If you don’t build in plateaus to slow down your progress, you may not give your body enough time to adapt.

You may become too lean, too fast, for your own good. The more successful the diet, the bigger is the risk. No wonder the paleo diet is being targeted lately as a “bad” diet. How can you go wrong on a diet of whole foods; “real” whole foods, not “whole wheat”? Well, here is how you can go wrong. The diet, if not managed properly, may be too successful for your own good; too much of a good thing can be a problem, you know!

See the graph below, from a previous post on a related topic (). I intend to discuss a method to identify the point at which weight loss should stop, in a future post. This method builds on the calculation of a simple index, which is unique to each individual. Let me just say now that I suspect that, with exceptions, frequently people are hurting their health by trying to have six pack abs.


But what does all this have to do with stress hormones? The connection is this. Hypoglycemia is only “felt”, as something unpleasant, due to the body’s frequent acute stress hormone response to it. Elevated levels of stress hormones also increase blood glucose levels, countering hypoglycemia. Our body’s priority is preventing hypoglycemia, not hyperglycemia ().

And here is an interesting pattern, based on anecdotal evidence from HCE () users. It seems that folks who have abnormally high insulin sensitivity, also have medium-to-high HbA1c (a measure of glycation) and fasting blood glucose levels. By medium-to-high HbA1c levels I mean 5.7 to even as high as 6.2.

Since cortisol is elevated, one would expect higher fasting blood glucose levels – the “dawn phenomenon”. But higher HbA1c, how? I am not sure, but I believe that HbA1c will be found in the future to be something a bit more complicated than what it is believed to be: a measure of average blood glucose over a period of time. I am not talking here about cases of anemia.

One indication of this complicated nature of the HbA1c is the fact that blood glucose levels in birds are high yet HbA1c levels are low, and birds live much longer than mammals of comparable size (). Some birds have extremely high glucose levels, even carnivorous birds who consume no or very small amounts of carbohydrate (e.g. hawks), with fairly low HbA1c levels.

The title of this post is inspired in the classic short novel “Strange Case of Dr. Jekyll and Mr. Hyde” by the Scottish author Robert Louis Stevenson; who also authored another famous novel, “Treasure Island”. In “Dr. Jekyll and Mr. Hyde”, gentle Dr. Jekyll becomes nasty Mr. Hyde (see poster below, from Wikipedia).


Mr. Hyde had a bad temper, impaired judgment, and was prone to criminal behavior. Hypoglycemia has long been associated with bad temper, impaired judgment, and criminal behavior (, ).

Monday, May 20, 2013

Sudden cholesterol increase? It may be psychological


There are many published studies with evidence that cholesterol levels are positively associated with heart disease. In multivariate analyses the effects are usually small, but they are still there. On the other hand, there is also plenty of evidence that cholesterol is beneficial in terms of health. Here of course I am referring to the health of humans, not of the many parasites that benefit from disease.

For example, there is evidence () that cholesterol levels are negatively associated with mortality (i.e., higher cholesterol leading to lower mortality), and are positively associated with vitamin D production from skin exposure to sunlight ().

Most of the debris accumulated in atheromas are made up of macrophages, which are specialized cells that “eat” cell debris (ironically) and some pathogens. The drug market is still hot for cholesterol-lowering drugs, often presented in TV and Internet ads as effective tools to prevent formation of atheromas.

But what about macrophages? What about calcium, another big component of atheromas? If drugs were to target macrophages for atheroma prevention, drug users may experience major muscle wasting and problems with adaptive immunity, as macrophages play a key role in muscle repair and antibody formation. If drugs were to target calcium, users may experience osteoporosis.

So cholesterol is the target, because there is a “link” between cholesterol and atheroma formation. There is also a link between the number of house fires in a city and the amount of firefighting activity in the city, but we don’t see mayors announcing initiatives to reduce the number of firefighters in their cities to prevent house fires.

When we talk about variations in cholesterol, we usually mean variations in cholesterol carried by LDL particles. That is because LDL cholesterol seems to be very “sensitive” to a number of factors, including diet and disease, presenting quite a lot of sudden variation in response to changes in those factors.

LDL particles seem to be intimately involved with disease, but do not be so quick to conclude that they cause disease. Something so widespread and with so many functions in the human body could not be primarily an agent of disease that needs to be countered with statins. That makes no sense.

Looking at the totally of evidence linking cholesterol with health, it seems that cholesterol is extremely important for the human body, particularly when it is under attack. So the increases in LDL cholesterol associated with various diseases, notably heart disease, may not be because cholesterol is causing disease, but rather because cholesterol is being used to cope with disease.

LDL particles, and their content (including cholesterol), may be used by the body to cope with conditions that themselves cause heart disease, and end up being blamed in the process. The lipid hypothesis may be a classic case of reverse causation. A case in point is that of cholesterol responses to stress, particularly mental stress.

Grundy and Griffin () studied the effects of academic final examinations on serum cholesterol levels in 2 groups of medical students in the winter and spring semesters (see table below). During control periods, average cholesterol levels in the two groups were approximately 213 and 216 mg/dl. During the final examination periods, average cholesterol levels were 248 and 240 mg/dl. These measures were for winter and spring, respectively.


One could say that even the bigger increase from 213 to 248 is not that impressive in percentage terms, approximately 16 percent. However, HDL cholesterol does not go up significantly response to sustained (e.g., multi-day) stress, it actually goes down, so the increases reported can be safely assumed to be chiefly due to LDL cholesterol. For most people, LDL particles are the main carriers of cholesterol in the human body. Thus, in percentage terms, the increases in LDL cholesterol are about twice those reported for total cholesterol.

A 32-percent increase (16 x 2) in LDL cholesterol would not go unnoticed today. If one’s LDL cholesterol were to be normally 140 mg/dl, it would jump to 185 mg/dl with a 32-percent increase. It looks like the standard deviations were more than 30 in the study. (This is based on the standard errors reported, and assuming that the standard deviation equals the standard error multiplied by the square root of the sample size.) So we can guess that several people might go from 140 to 215 or more (this is LDL cholesterol, in mg/dl) in response to the stress from exams.

And the effects above were observed with young medical students, in response to the stress from exams. What about a middle-aged man or woman trying to cope with chronic mental stress for months or years, due to losing his or her job, while still having to provide for a family? Or someone who has just been promoted, and finds himself or herself overwhelmed with the new responsibilities?

Keep in mind that sustained dieting can be a major stressor for some people, particular when one gets to that point in the dieting process where he or she gets regularly into negative nitrogen balance (muscle loss). So you may have heard from people saying that, after months or years of successful dieting, their cholesterol levels are inexplicably going up. Well, this post provides one of many possible explanations for that.

The finding that cholesterol goes up with stress has been replicated many times. It has been known for a long time, with studies dating back to the 1950s. Wertlake and colleagues () observed an increase in average cholesterol levels from 214 to 238 (in mg/dl); also among medical students, in response to the mental and emotional stress of an examination week. A similar study to the one above.

Those enamored with the idea of standing up the whole day, thinking that this will make them healthy, should know that performing cognitively demanding tasks while standing up is a known stressor. It is often used in research where stress must be induced to create an experimental condition. Muldoon and colleagues () found that people performing a mental task while standing experienced an increase in serum cholesterol of approximately 22 points (in mg/dl).

What we are not adapted for is sitting down for long hours in very comfortable furniture (, ). But our anatomy clearly suggests adaptations for sitting down, particularly when engaging in activities that resemble tool-making, a hallmark of the human species. Among modern hunter-gatherers, tool-making is part of daily life, and typically it is much easier to accomplish sitting down than standing up.

Modern urbanites could be seen as engaging in activities that resemble tool-making when they produce things at work for internal or external customers, whether those things are tangible or intangible.

So, stress is associated with cholesterol levels, and particularly with LDL cholesterol levels. Diehard lipid hypothesis proponents may argue that this is how stress is associated with heart disease: stress increases cholesterol which increases heart disease. Others may argue that one of the reasons why LDL cholesterol levels are sometimes found to be associated with heart disease-related conditions, such as chronic stress, and other health conditions is that the body is using LDL cholesterol to cope with those conditions.

Specifically regarding mental stress, a third argument has been put forth by Patterson and colleagues, who claimed that stress-mediated variations in blood lipid concentrations are a secondary result of decreased plasma volume. The cause, in their interpretation, was unspecified – “vascular fluid shifts”. However, when you look at the numbers reported in their study, you still see a marked increase in LDL cholesterol, even controlling for plasma volume. And this is all in response to “10 minutes of mental arithmetic with harassment” ().

I tend to think that the view that cholesterol increases with stress because cholesterol is used by the body to cope with stress is the closest to the truth. Among other things, stress increases the body’s overall protein demand, and cholesterol is used in the synthesis of many proteins. This includes proteins used for signaling, also known as hormones.

Cholesterol also seems to be a diet marker, tending to go up in high fat diets. This is easier to explain. High fat diets increase the demand for bile production, as bile is used in the digestion of fat. Most of the cholesterol produced by the human body is used to make bile.

 
Design by Free WordPress Themes | Bloggerized by Lasantha - Premium Blogger Themes | Justin Bieber, Gold Price in India