Tuesday, November 29, 2011

My appeal video for Hexham River Hydro (@energyshare)

Last week I had the unique opportunity to visit Hexham and meet the community with whom I have partnered in the bid to win funding from energyshare.

I received the most amazing welcome from so many people in the community, including the project partners, volunteers, Transition Town members, the local Abbey, councillors and the Mayor.  However it was the visits I made to the potential beneficiaries of the funding that inspired me the most, including a local community centre in regeneration area and the fabulous kids who really need their local youth initiative.

Armed with just my very old smartphone, I managed to take some footage while I was there, to ask for your support in voting for a community project that will not just create renewable energy but will help provide some much-needed social projects too.  So please, take a look and then I urge you to join in the EnergyShare vote. The deadline is 5pm 3 December, so Hexham River Hydro needs your support urgently.


To vote, you will need to register your email address at www.energyshare.com, but it doesn't take long and you will be in with a chance of winning one of five River Cottage books that are being given away each day.  It will only take 5 minutes, and if you vote for Hexham River Hydro and their public vote is successful, you will be making a real difference to a community's heritage and social well-being as well as helping to create an amazing renewable energy project that will be a valuable resource for the rest of the UK.

___________________________________________________________

This is a sponsored opportunity on behalf of British Gas. However, all the author's views and research are her own.

Photos of the visit are now also publicly available on Facebook.

Monday, November 28, 2011

Triglycerides, VLDL, and industrial carbohydrate-rich foods

Below are the coefficients of association calculated by HealthCorrelator for Excel (HCE) for user John Doe. The coefficients of association are calculated as linear correlations in HCE (). The focus here is on the associations between fasting triglycerides and various other variables. Take a look at the coefficient of association at the top, with VLDL cholesterol, indicated with a red arrow. It is a very high 0.999.


Whoa! What is this – 0.999! Is John Doe a unique case? No, this strong association between fasting triglycerides and VLDL cholesterol is a very common pattern among HCE users. The reason is simple. VLDL cholesterol is not normally measured directly, but typically calculated based on fasting triglycerides, by dividing the fasting triglycerides measurement by 5. And there is an underlying reason for that - fasting triglycerides and VLDL cholesterol are actually very highly correlated, based on direct measurements of these two variables.

But if VLDL cholesterol is calculated based on fasting triglycerides (VLDL cholesterol  = fasting triglycerides / 5), how come the correlation is 0.999, and not a perfect 1? The reason is the rounding error in the measurements. Whenever you see a correlation this high (i.e., 0.999), it is reasonable to suspect that the source is an underlying linear relationship disturbed by rounding error.

Fasting triglycerides are probably the most useful measures on standard lipid panels. For example, fasting triglycerides below 70 mg/dl suggest a pattern of LDL particles that is predominantly of large and buoyant particles. This pattern is associated with a low incidence of cardiovascular disease (). Also, chronically high fasting triglycerides are a well known marker of the metabolic syndrome, and a harbinger of type 2 diabetes.

Where do large and buoyant LDL particles come from? They frequently start as "big" (relatively speaking) blobs of fat, which are actually VLDL particles. The photo is from the excellent book by Elliott & Elliott (); it shows, on the same scale: (a) VLDL particles, (b) chylomicrons, (c) LDL particles, and (d) HDL particles. The dark bar at the bottom of each shot is 1000 A in length, or 100 nm (A = angstrom; nm = nanometer; 1 nm = 10 A).


If you consume an excessive amount of carbohydrates, my theory is that your liver will produce an abnormally large number of small VLDL particles (also shown on the photo above), a proportion of which will end up as small and dense LDL particles. The liver will do that relatively quickly, probably as a short-term compensatory mechanism to avoid glucose toxicity. It will essentially turn excess glucose, from excess carbohydrates, into fat. The VLDL particles carrying that fat in the form of triglycerides will be small because the liver will be in a hurry to clear the excess glucose in circulation, and will have no time to produce large particles, which take longer to produce individually.

This will end up leading to excess triglycerides hanging around in circulation, long after they should have been used as sources of energy. High fasting triglycerides will be a reflection of that. The graphs below, also generated by HCE for John Doe, show how fasting triglycerides and VLDL cholesterol vary in relation to refined carbohydrate consumption. Again, the graphs are not identical in shape because of rounding error; the shapes are almost identical.


Small and dense LDL particles, in the presence of other factors such as systemic inflammation, will contribute to the formation of atherosclerotic plaques. Again, the main source of these particles would be an excessive amount of carbohydrates. What is an excessive amount of carbohydrates? Generally speaking, it is an amount beyond your liver’s capacity to convert the resulting digestion byproducts, fructose and glucose, into liver glycogen. This may come from spaced consumption throughout the day, or acute consumption in an unnatural form (a can of regular coke), or both.

Liver glycogen is sugar stored in the liver. This is the main source of sugar for your brain. If your blood sugar levels become too low, your brain will get angry. Eventually it will go from angry to dead, and you will finally find out what awaits you in the afterlife.

Should you be a healthy athlete who severely depletes liver glycogen stores on a regular basis, you will probably have an above average liver glycogen storage and production capacity. That will be a result of long-term compensatory adaptation to glycogen depleting exercise (). As such, you may be able to consume large amounts of carbohydrates, and you will still not have high fasting triglycerides. You will not carry a lot of body fat either, because the carbohydrates will not be converted to fat and sent into circulation in VLDL particles. They will be used to make liver glycogen.

In fact, if you are a healthy athlete who severely depletes liver glycogen stores on a regular basis, excess calories will be just about the only thing that will contribute to body fat gain. Your threshold for “excess” carbohydrates will be so high that you will feel like the whole low carbohydrate community is not only misguided but also part of a conspiracy against people like you. If you are also an aggressive blog writer, you may feel compelled to tell the world something like this: “Here, I can eat 300 g of carbohydrates per day and maintain single-digit body fat levels! Take that you low carbohydrate idiots!”

Let us say you do not consume an excessive amount of carbohydrates; again, what is excessive or not varies, probably dramatically, from individual to individual. In this case your liver will produce a relatively small number of fat VLDL particles, which will end up as large and buoyant LDL particles. The fat in these large VLDL particles will likely not come primarily from conversion of glucose and/or fructose into fat (i.e., de novo lipogenesis), but from dietary sources of fat.

How do you avoid consuming excess carbohydrates? A good way of achieving that is to avoid man-made carbohydrate-rich foods. Another is adopting a low carbohydrate diet. Yet another is to become a healthy athlete who severely depletes liver glycogen stores on a regular basis; then you can eat a lot of bread, pasta, doughnuts and so on, and keep your fingers crossed for the future.

Either way, fasting triglycerides will be strongly correlated with VLDL cholesterol, because VLDL particles contain both triglycerides (“encapsulated” fat, not to be confused with “free” fatty acids) and cholesterol. If a large number of VLDL particles are produced by one’s liver, the person’s fasting triglycerides reading will be high. If a small number of VLDL particles are produced, even if they are fat particles, the fasting triglycerides reading will be relatively low. Neither VLDL cholesterol nor fasting triglycerides will be zero though.

Now, you may be wondering, how come a small number of fat VLDL particles will eventually lead to low fasting triglycerides? After all, they are fat particles, even though they occur in fewer numbers. My hypothesis is that having a large number of small-dense VLDL particles in circulation is an abnormal, unnatural state, and that our body is not well designed to deal with that state. Use of lipoprotein-bound fat as a source of energy in this state becomes somewhat less efficient, leading to high triglycerides in circulation; and also to hunger, as our mitochondria like fat.

This hypothesis, and the theory outlined above, fit well with the numbers I have been seeing for quite some time from HCE users. Note that it is a bit different from the more popular theory, particularly among low carbohydrate writers, that fat is force-stored in adipocytes (fat cells) by insulin and not released for use as energy, also leading to hunger. What I am saying here, which is compatible with this more popular theory, is that lipoproteins, like adipocytes, also end up holding more fat than they should if you consume excess carbohydrates, and for longer.

Want to improve your health? Consider replacing things like bread and cereal with butter and eggs in your diet (). And also go see you doctor (); if he disagrees with this recommendation, ask him to read this post and explain why he disagrees.

Monday, November 21, 2011

My transformation: How I looked 10 years ago next to a thin man called Royce Gracie

The photos below were taken about 10 years ago. The first is at a restaurant near Torrance, California. (As you can see, the restaurant was about to close; we were the last customers.) I am standing next to Royce Grace, who had by then become a sensation (). He became a sensation by easily defeating nearly every champion fighter that was placed in front of him. In case you are wondering, Royce is 6’1” and I am 5’8”. The second photo also has Royce’s manager in it – that is his wife. Their children’s names both start with the letter “K”. I wonder how big they are right now.


I think that at the time these photos were taken I weighed around 200-210 lbs. Even though I am much shorter than Royce, I outweighed him by around 40 lbs. Now I weigh 150 lbs, at about 11 percent body fat, and look like the photo on the top-right area of this blog - essentially like a thin guy who does some manual labor for a living, I guess. A post is available discussing the "how" part of this transformation (). I only put a shirtless photo here after several readers told me that my previous photo looked out of place in this blog.

My day job is not even remotely related to fitness instruction. I am a college professor, and like to think of myself as a scholar. I don’t care much about my personal appearance; never did. At least in my mind, putting up shirtless photos on the web should not be done gratuitously. If you are a fitness instructor, or an athlete, that is fine. In my case, it is acceptable in the context of telling people that a few minutes of mid-day sun exposure, avoiding sunburn, yields 10,000 IU of skin-produced vitamin D, which is about 20 times more than one can get through most "fortified" industrial foods.

Royce is such a nice guy that, after much insistence, he paid for the dinner, and then we drove to his house and talked until about midnight. He had told me of a flight the next morning to Chicago, so I ended the interview and thanked him for the wonderful time we had spent together. I had to talk him out of driving ahead of me to I-405; he wanted to make sure I was not going to get lost at that time of the night. This was someone who was considered a demigod at the time in some circles. A humble, wonderful person.

Royce helped launch what is today the mega-successful Ultimate Fighting Championship franchise (), which was then still a no holders barred mixed martial arts tournament. At the time the photos were taken I was interviewing him for my book Compensatory Adaptation, which came out in print soon after (). The book has a full chapter on the famous Gracie Family, including his father Helio and his brother Rickson.

I talked before about the notion of compensatory adaptation and how it applies to our understanding of how we respond to diet and lifestyle changes (). In this context, I believe that the compensatory adaptation notion is far superior to that of hormesis (), which I think is interesting but overused and overrated.

The notion of compensatory adaptation has been picked up in the field of information systems, my main field of academic research. In this field, which deals with how people respond to technologies, it is part of a broader theory called media naturalness theory (). There are already several people who have received doctorates by testing this theory from novel angles. There are also several people today who call themselves experts in compensatory adaptation and media naturalness theory.

The above creates an odd situation, and something funny that happened with me a few times already. I do some new empirical research on compensatory adaptation, looking at it from a new angle, write an academic paper about it (often with one or more co-authors who helped me collect empirical data), and submit it to a selective refereed journal. Then an "expert" reviewer, who does not know who the authors of the paper are (this is called a "blind" review), recommends rejection of the paper because “the authors of this paper clearly do not understand the notion of compensatory adaptation”. Sometimes something like this is added: “the authors should read the literature on compensatory adaptation more carefully, particularly Kock (2004)” - an article that has a good number of citations to it ().

Oh well, the beauty of the academic refereeing process …

Tuesday, November 15, 2011

Teaming up with energyshare & Hexam River Hydro


It is very rare that something pulls me away from talking about rubbish, but when I was asked to team up with an exciting hydro energy project that's competing for energyshare funding, it was far too interesting to miss.


Energyshare has been created by River Cottage and British Gas, jointly managing a campaign whereby communities across the UK have applied to energyshare to have their project funded. These communities have been shortlisted into a small number of finalists, all looking to have their project funded up to the value of £100,000.

The competition has also been supported by Channel 4’s Three Hungry Boy’s who spent five weeks touring the South West over the summer, visiting communities just like those shortlisted for energyshare funding. Trevor, Thom and Tim were challenged by River Cottage’s Hugh Fearnley Whittingstall to live off the land and barter their way around the countryside, sourcing the energy for their electric vehicle from renewable technologies.

Today the finalists have been announced and campaigning has now begun in earnest to help generate public votes to choose the winning communities.


All the finalists are brilliant in their own way.  The community that I am supporting is Hexham River Hydro, a fabulous project which will create a100kW community hydro power generation scheme on the River Tyne in Northumberland.   It is a joint initiative by Hexham Community Partnership and Transition Tynedale and for anyone who, like me, has grown up or lived near such a similar powerful waterway, it is very easy to get excited about the possibilities of harnessing such energy.

However, this project is not just about generating renewable electricity, it is also about securing sustainable funding for social and economic regeneration and community activities in the market town of Hexham and its environs, as well as creating an education and awareness-raising tool for residents and visitors alike.

When I say, I'm very excited about this project, I really mean it and can't wait to get to meet the people and the community behind it. Having spoken to team member Gillian Orrell, this afternoon, I am now looking forward to a trip up north to find out more about their hopes and plans. This project may seem that it's about technology, but at the heart of it, it's really about people and harnessing the energy around us, without impacting on the environment itself.  It's amazing to think that it will generate approximately 700MWh of electricity per year – enough to satisfy the average electricity consumption of 150 households, whicle reducing Hexham’s carbon emissions by approximately 400 tonnes CO2 per year.

With such localised energy supply, it is also deemed a project of national significance that will be of interest to other similar communities around the UK.

I will be able to report on my discoveries next week, but in the meantime, if you are over 13-years-old and have just two minutes to spare, please get voting at the energyshare website.  More information about Hexam River Hydro can be found at www.energyshare.com/hrh. So, please pop over and if you like what you see, please do hurry and vote for them.

Voting is open until 5pm on 3rd December with the opportunity to win one of 5 books that River Cottage is giving away every day to voters. Furthermore, for the energyshare Group that gets the most supporters voting, there is the chance to scoop a £1,000 cash prize.

So please do get involved now and visit energyshare.com/voting.

____________________________________________________________________

This is a sponsored opportunity on behalf of British Gas. However, all the author's views are her own.

Saturday, November 5, 2011

The China Study II: How gender takes us to the elusive and deadly factor X

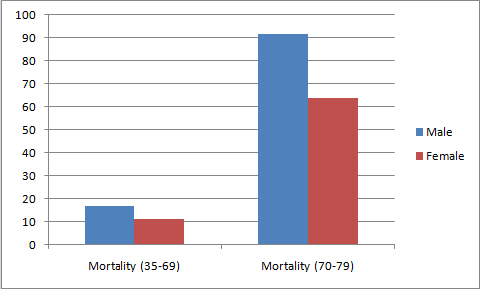
The graph below shows the mortality in the 35-69 and 70-79 age ranges for men and women for the China Study II dataset. I discussed other results in my two previous posts () (), all taking us to this post. The full data for the China Study II study is publicly available (). The mortality numbers are actually averages of male and female deaths by 1,000 people in each of several counties, in each of the two age ranges.


Men do tend to die earlier than women, but the difference above is too large.

Generally speaking, when you look at a set time period that is long enough for a good number of deaths (not to be confused with “a number of good deaths”) to be observed, you tend to see around 5-10 percent more deaths among men than among women. This is when other variables are controlled for, or when men and women do not adopt dramatically different diets and lifestyles. One of many examples is a study in Finland (); you have to go beyond the abstract on this one.

As you can see from the graph above, in the China Study II dataset this difference in deaths is around 50 percent!

This huge difference could be caused by there being significantly more men than women per county included the dataset. But if you take a careful look at the description of the data collection methods employed (), this does not seem to be the case. In fact, the methodology descriptions suggest that the researchers tried to have approximately the same number of women and men studied in each county. The numbers reported also support this assumption.

As I said before, this is a well executed research project, for which Dr. Campbell and his collaborators should be commended. I may not agree with all of their conclusions, but this does not detract even a bit from the quality of the data they have compiled and made available to us all.

So there must be another factor X causing this enormous difference in mortality (and thus longevity) among men and women in the China Study II dataset.

What could be this factor X?

This situation helps me illustrate a point that I have made here before, mostly in the comments under other posts. Sometimes a variable, and its effects on other variables, are mostly a reflection of another unmeasured variable. Gender is a variable that is often involved in this type of situation. Frequently men and women do things very differently in a given population due to cultural reasons (as opposed to biological reasons), and those things can have a major effect on their health.

So, the search for our factor X is essentially a search for a health-relevant variable that is reflected by gender but that is not strictly due to the biological aspects that make men and women different (these can explain only a 5-10 percent difference in mortality). That is, we are looking for a variable that shows a lot of variation between men and women, that is behavioral, and that has a clear impact on health. Moreover, as it should be clear from my last post, we are looking for a variable that is unrelated to wheat flour and animal protein consumption.

As it turns out, the best candidate for the factor X is smoking, particularly cigarette smoking.

The second best candidate for factor X is alcohol abuse. Alcohol abuse can be just as bad for one’s health as smoking is, if not worse, but it may not be as good a candidate for factor X because the difference in prevalence between men and women does not appear to be just as large in China (). But it is still large enough for us to consider it a close second as a candidate for factor X, or a component of a more complex factor X – a composite of smoking, alcohol abuse and a few other coexisting factors that may be reflected by gender.

I have had some discussions about this with a few colleagues and doctoral students who are Chinese (thanks William and Wei), and they mentioned stress to me, based on anecdotal evidence. Moreover, they pointed out that stressful lifestyles, smoking, and alcohol abuse tend to happen together - with a much higher prevalence among men than women.

What an anti-climax for this series of posts eh?

With all the talk on the Internetz about safe and unsafe starches, animal protein, wheat bellies, and whatnot! C’mon Ned, give me a break! What about insulin!? What about leucine deficiency … or iron overload!? What about choline!? What about something truly mysterious, related to an obscure or emerging biochemistry topic; a hormone du jour like leptin perhaps? Whatever, something cool!

Smoking and alcohol abuse!? These are way too obvious. This is NOT cool at all!

Well, reality is often less mysterious than we want to believe it is.

Let me focus on smoking from here on, since it is the top candidate for factor X, although much of the following applies to alcohol abuse and a combination of the two as well.

One gets different statistics on cigarette smoking in China depending on the time period studied, but one thing seems to be a common denominator in these statistics. Men tend to smoke in much, much higher numbers than women in China. And this is not a recent phenomenon.

For example, a study conducted in 1996 () states that “smoking continues to be prevalent among more men (63%) than women (3.8%)”, and notes that these results are very similar to those in 1984, around the time when the China Study II data was collected.

A 1995 study () reports similar percentages: “A total of 2279 males (67%) but only 72 females (2%) smoke”. Another study () notes that in 1976 “56% of the men and 12% of the women were ever-smokers”, which together with other results suggest that the gap increased significantly in the 1980s, with many more men than women smoking. And, most importantly, smoking industrial cigarettes.

So we are possibly talking about a gigantic difference here; the prevalence of industrial cigarette smoking among men may have been over 30 times the prevalence among women in the China Study II dataset.

Given the above, it is reasonable to conclude that the variable “SexM1F2” reflects very strongly the variable “Smoking”, related to industrial cigarette smoking, and in an inverse way. I did something that, grossly speaking, made the mysterious factor X explicit in the WarpPLS model discussed in my previous post. I replaced the variable “SexM1F2” in the model with the variable “Smoking” by using a reverse scale (i.e., 1 and 2, but reversing the codes used for “SexM1F2”). The results of the new WarpPLS analysis are shown on the graph below. This is of course far from ideal, but gives a better picture to readers of what is going on than sticking with the variable “SexM1F2”.


With this revised model, the associations of smoking with mortality in the 35-69 and 70-79 age ranges are a lot stronger than those of animal protein and wheat flour consumption. The R-squared coefficients for mortality in both ranges are higher than 20 percent, which is a sign that this model has decent explanatory power. Animal protein and wheat flour consumption are still significantly associated with mortality, even after we control for smoking; animal protein seems protective and wheat flour detrimental. And smoking’s association with the amount of animal protein and wheat flour consumed is practically zero.

Replacing “SexM1F2” with “Smoking” would be particularly far from ideal if we were analyzing this data at the individual level. It could lead to some outlier-induced errors; for example, due to the possible existence of a minority of female chain smokers. But this variable replacement is not as harmful when we look at county-level data, as we are doing here.

In fact, this is as good and parsimonious model of mortality based on the China Study II data as I’ve ever seen based on county level data.

Now, here is an interesting thing. Does the original China Study II analysis of univariate correlations show smoking as a major problem in terms of mortality? Not really.

The table below, from the China Study II report (), shows ALL of the statistically significant (P<0.05) univariate correlations with mortality in 70-79 age range. I highlighted the only measure that is directly related to smoking; that is “dSMOKAGEm”, listed as “questionnaire AGE MALE SMOKERS STARTED SMOKING (years)”.


The high positive correlation with “dSMOKAGEm” does not even make a lot of sense, as one would expect a negative correlation here – i.e., the earlier in life folks start smoking, the higher should be the mortality. But this reverse-signed correlation may be due to smokers who get an early start dying in disproportionally high numbers before they reach age 70, and thus being captured by another age range mortality variable. The fact that other smoking-related variables are not showing up on the table above is likely due to distortions caused by inter-correlations, as well as measurement problems like the one just mentioned.

As one looks at these univariate correlations, most of them make sense, although several can be and probably are distorted by correlations with other variables, even unmeasured variables. And some unmeasured variables may turn out to be critical. Remember what I said in my previous post – the variable “SexM1F2” was introduced by me; it was not in the original dataset. “Smoking” is this variable, but reversed, to account for the fact that men are heavy smokers and women are not.

Univariate correlations are calculated without adjustments or control. To correct this problem one can adjust a variable based on other variables; as in “adjusting for age”. This is not such a good technique, in my opinion; it tends to be time-consuming to implement, and prone to errors. One can alternatively control for the effects of other variables; a better technique, employed in multivariate statistical analyses. This latter technique is the one employed in WarpPLS analyses ().

Why don’t more smoking-related variables show up on the univariate correlations table above? The reason is that the table summarizes associations calculated based on data for both sexes. Since the women in the dataset smoked very little, including them in the analysis together with men lowers the strength of smoking-related associations, which would probably be much stronger if only men were included. It lowers the strength of the associations to the point that their P values become higher than 0.05, leading to their exclusion from tables like the one above. This is where the aggregation process that may lead to ecological fallacy shows its ugly head.

No one can blame Dr. Campbell for not issuing warnings about smoking, even as they came mixed with warnings about animal food consumption (). The former warnings, about smoking, make a lot of sense based on the results of the analyses in this and the last two posts.

The latter warnings, about animal food consumption, seem increasingly ill-advised. Animal food consumption may actually be protective in regards to the factor X, as it seems to be protective in terms of wheat flour consumption ().

Tuesday, November 1, 2011

It's that time of year again with "Buy Nothing New November"


For the last few years I've welcomed in November with a personal challenge, to get through the month without buying anything new.  And after an expensive few months through the summer and early autumn, once more I'm welcoming the challenge with open arms for 2011.

It's not an anti-consumerism protest as such, although it does give me a great excuse to throw a huge boo-hiss at all the stores that promote the festive spirit months before December has arrived.

Yes, I admit the heavily commercial unseasonal 'seasonal promotions' regularly hack me off, what with Easter eggs on sale in January, back-to-school gear being promoted in June and the gradual appearance of Christmas paraphernalia showing its face as early as August!  Stuff that makes me go Grrrrrr!

However, regardless of what is going on outside my front door, the challenge is aimed at keeping my own levels of consumerism in check and building in a defence system against all those things that would have otherwise lured their way over the threshold.

I know some people thing I'm mad for attempting such a challenge during what many consider as the start of the Christmas Shopping period but it has proven to save me money and in turn, the less I buy, the less I waste.

Here are some examples of the benefits from previous years.
  1. Scrapping November from my Christmas shopping diary keeps me focused.  There are no temptations to buy all those 'extra' presents I would have once bought for the family. Don't get me wrong, they don't miss out, it simply helps to keep on top of the excess!
  2. Less temptation means fewer presents and less wrapping paper.  No longer do I return home with armfuls of wrapping paper, which only end up in the recycling bin. Instead we get crafty with inexpensive parcel paper, magazines, newspapers and reusable gift bags or festive fabric.
  3. Although food is obviously not on the 'banned list', the challenge gives me an opportunity to focus on using up what's already in the freezer and kitchen cupboards to make space for stocking up on the seasonal stuff to take us through the winter.  The Love Food Hate Waste site is always great for ideas.
  4. Less time shopping also gives me more time to have a go at making gifts instead.  There are loads of ideas around the Internet and Violet Posy's Thrifty Christmas site is one of my favourites, along with some great creative projects that can be found at LellaLoves.
  5. I won't be tempted to buy any spangly new outfits or accessories for the Christmas dinners or parties on my calendar.  Instead, I look forward to going through my wardrobe to plan what will work, without bowing to emergency feel-good purchases either in November or December.
So if you normally find yourself in the pre-Christmas rut, why not join me this year.  I admit, it can be daunting at first, but three years in and it's amazing how calm and in control a "Buy Nothing New November" can actually make you feel.  The best bit is, not only are you able to step back from the commercial rush, it makes December far more enjoyable too.

However, if a whole month seems too much of a challenge, there is some good news in that Saturday November 26th is officially Buy Nothing Day.  That's just one day, not a whole month. Much easier by comparison!  If you fancy a go at that, just click on the Keep Calm logo at the top of this post.

 
Design by Free WordPress Themes | Bloggerized by Lasantha - Premium Blogger Themes | Justin Bieber, Gold Price in India